When I was in my early twenties I read The Visual Display of Quantitative Information from Tufte and agonized over making charts great for users.
Uncategorized
25
Posts
17
Posters
0
Views
-
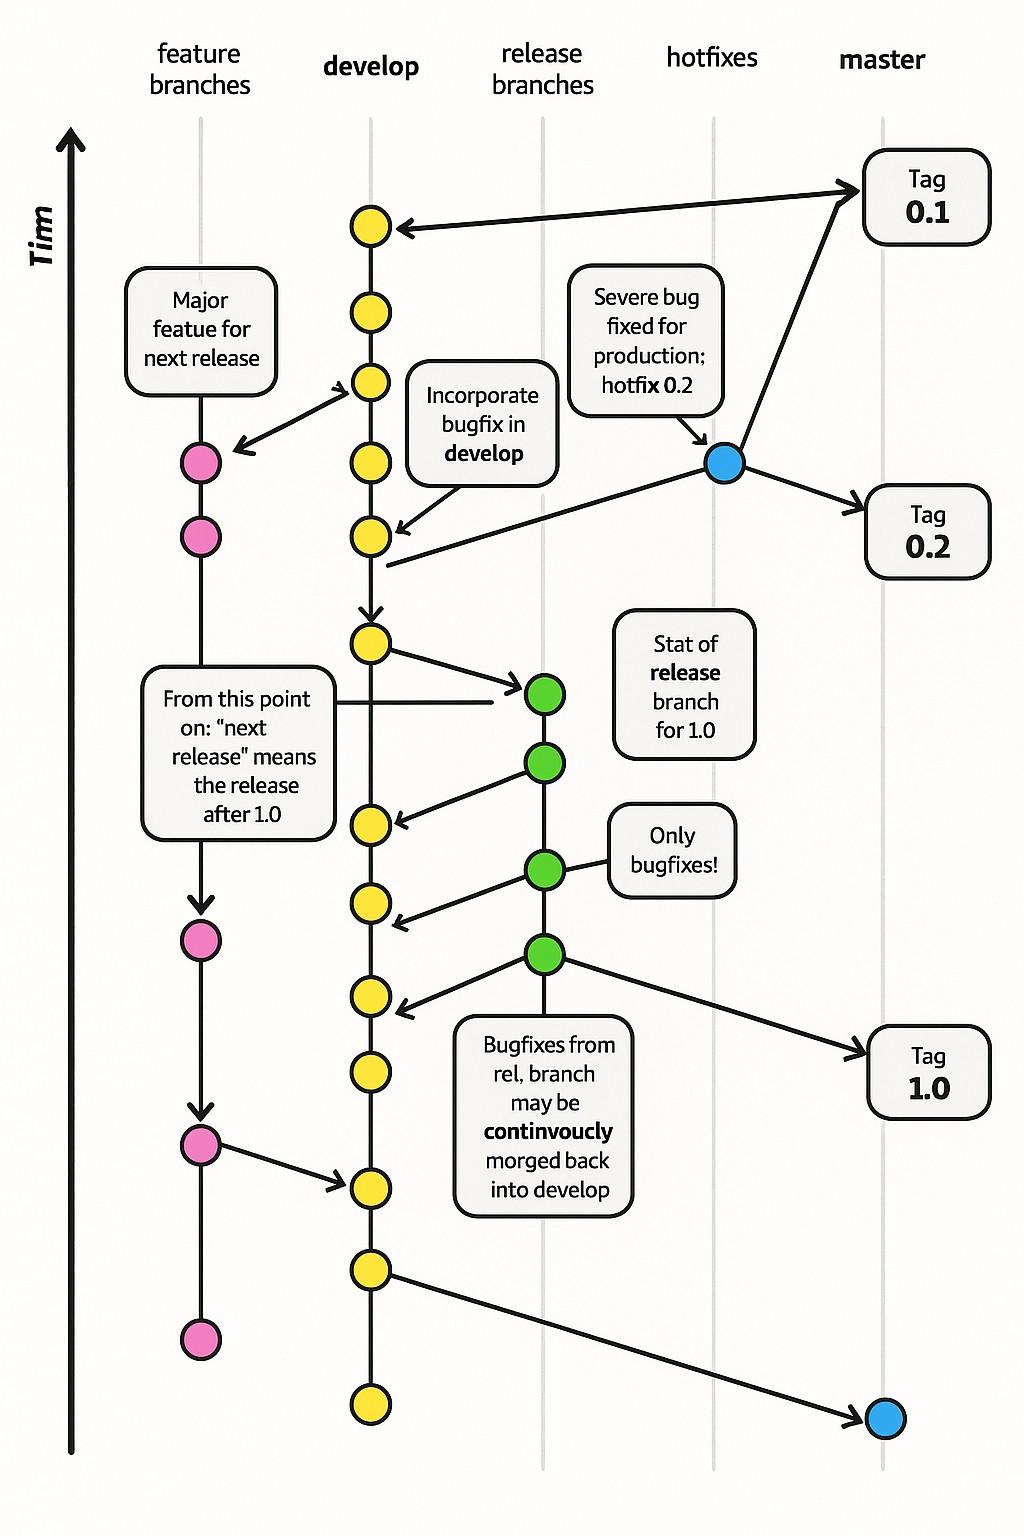
@thomasfuchs what is Tim doing on the left side?
@jal @thomasfuchs
Tim seems to be going backwards. I'm going to call Tim a Reverse Engineer -
@thomasfuchs did they just take the original (https://nvie.com/posts/a-successful-git-branching-model/) and run it through an image generator?
@colincornaby @thomasfuchs why, yes…yes they did https://social.lol/@db/116082055809272838
-
@NovemDecimal the technical term for this is “not giving a shit”
@thomasfuchs @NovemDecimal They only look at the page count. I've put recipes for making a chocolate cake in the middle of a large, dumb, mandated document and nobody ever noticed.
-
@thomasfuchs What letter is that?

@bplein @thomasfuchs It’s the letter “൬org”, of course.
-
R ActivityRelay shared this topic